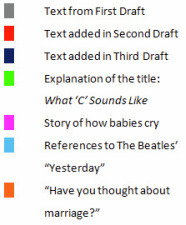
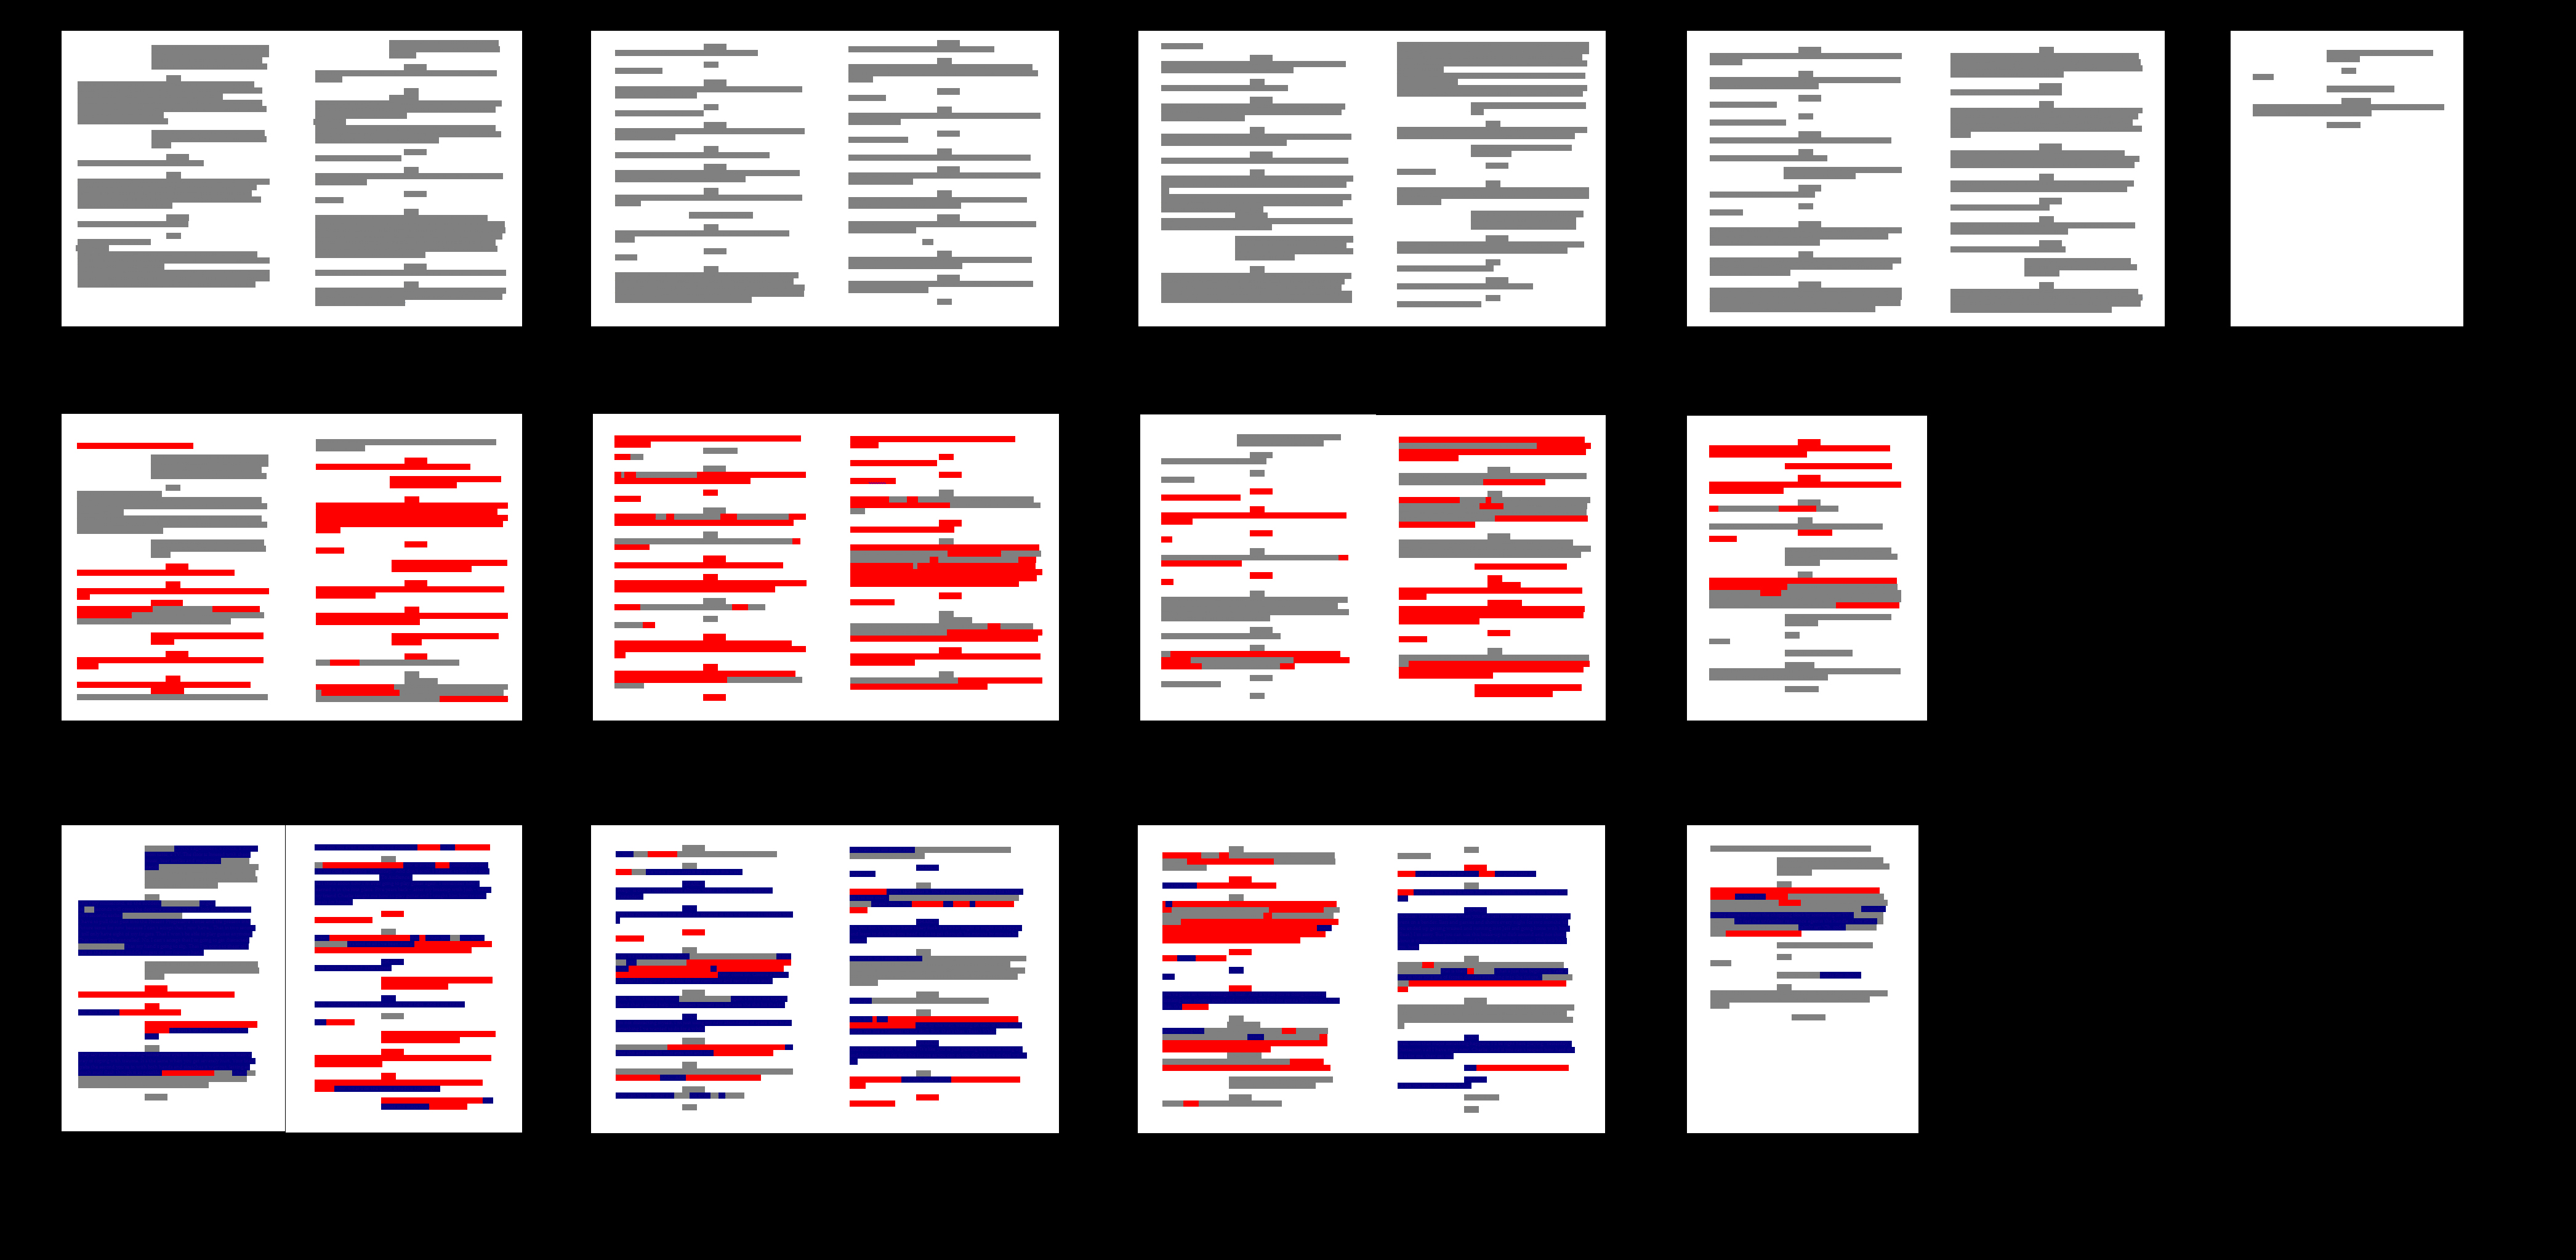
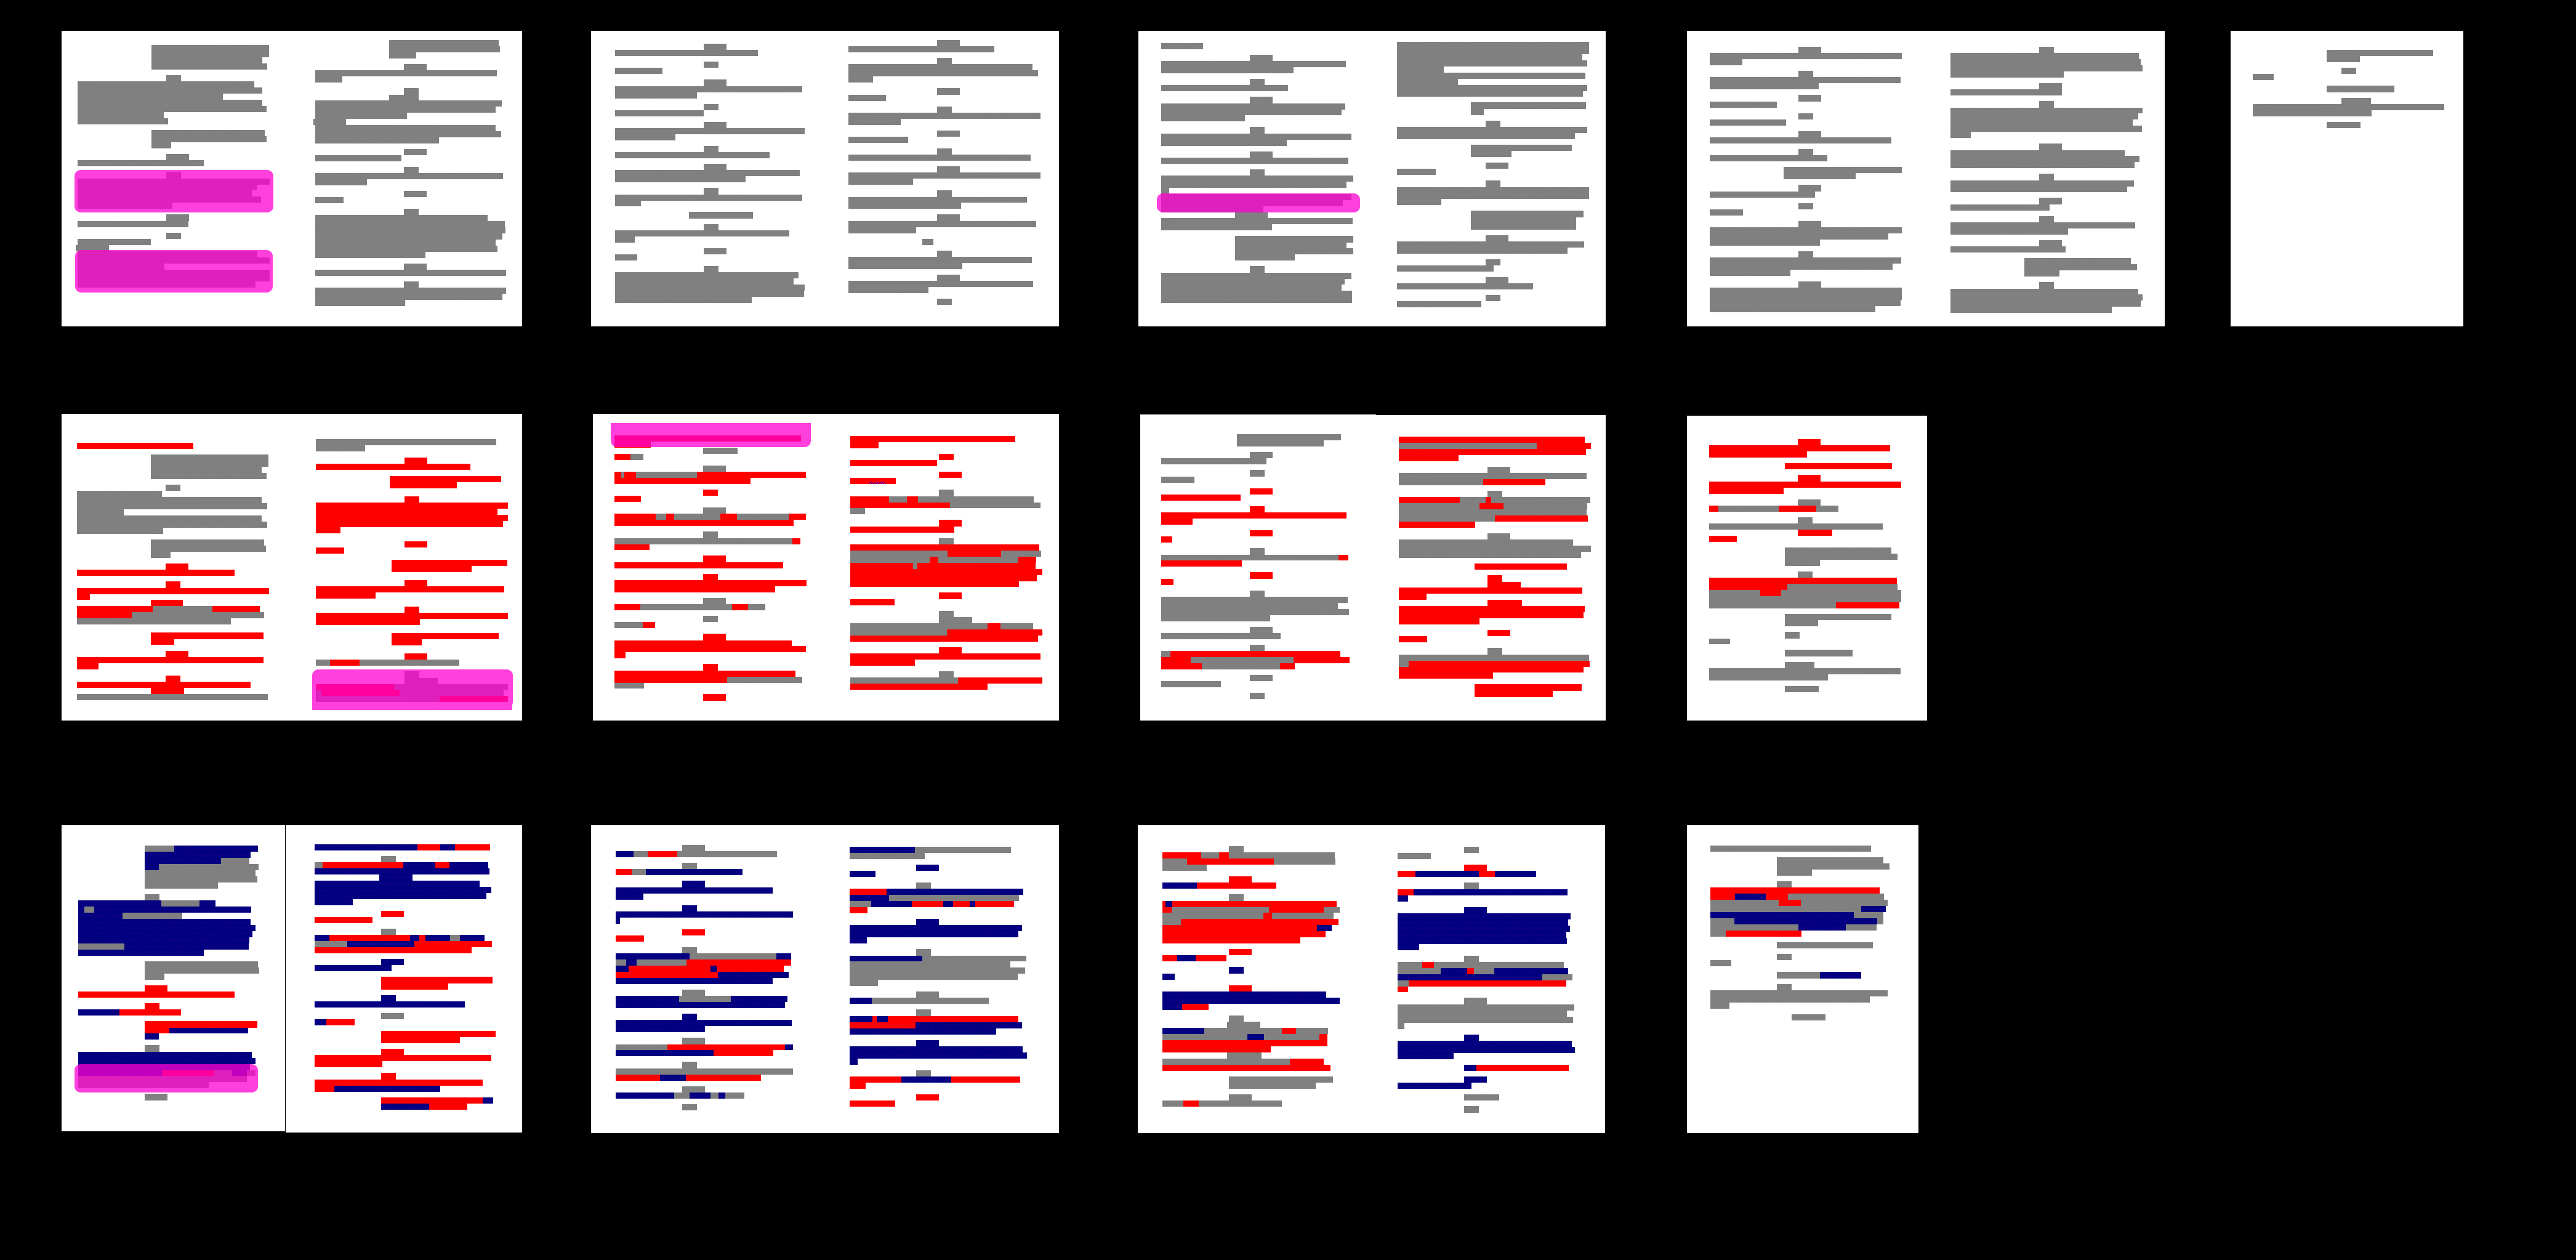
• Home
  • Bio
  • Ten-Minute / One-Act
    • Ten-minute Plays
    • One-Person Plays
  • Full-Length
  • Conferences / Projects
    • Visual Display
    • MATC 2009
  • Teaching
  • Contact
Litpunk The Digital Presence of Garret Schneider


Projects

[2010] 
Visual Display of the Re-writing Process 

Picture

Display the Data

When you click on a link below, the image will open in a new window.

First page of all three drafts.
(jpg)

Entirety of all three drafts. 
(jpg)

Explanation of the Title 
(jpg)

Story of how babies cry 
(jpg)

References to The Beatles' Yesterday 
(jpg)

"Have you thought about marriage?" 
(jpg)

Idea Behind the Map

Any map is a visual display of data.  The data the cartographer wishes to display dictates the style and type of map: wishing to focus on Maine, a Mercator projection of the world would be a poor choice. 

I decided to examine the re-writing process of a ten-minute play using colors as delineation between new and old work.

Looking at the map, the viewer can tell their own story about the rewriting process of the selected playwright: the second draft is when he/she really swings into action, the first draft is primarily to get an idea of what the play is about, they really made a breakthrough in the third draft.

Seeing how an object changes over time gives the viewer a sense of control and entitlement, and I would like to give my audience that same sense of certainty in the creative process. 

I believe that certainty can be found on the border between traditional maps, and graphs.  While a traditional map tries to render visual borders to scale (thereby giving us power over the arbitrary), the graph gives us confidence in the past/present/future of matter: the heating properties of tungsten, the GDP of the USA every year, or the re-writing process of a third-year playwright.

I thought the best way to show comparison between the two drafts is to display the pages horizontally, allowing the natural motion of the eyes path to dictate the audience’s journey through the re-writing process.  The only color chosen with a purpose was the color for the first draft (grey), as I wanted a muted backdrop for the rest of the changes.

To serve as a benchmark, I chose to track four different moments from the play What ‘C’ Sounds Like, picking four important moments in one draft, and seeing how it moved and redefined itself as the play became more-developed.

Note: For a sample, look at the color-legend to the left, and the sample below.  If you click it, it will get bigger.


Picture
Powered by Create your own unique website with customizable templates.